
Why all digital marketers need Power BI as their data analytics reporting tool.
According to research, digital marketing was worth almost US$155.3 Billion in 2021. The annual compound growth is estimated to be 18.2% until 2028.
Yet reporting is often one of the most challenging aspects of any marketing campaign. Hands up if you’re a digital marketer and struggle with reporting. ?
If you rely on spreadsheets to combine multiple data sources, chances are you’ve faced the frustration of being left with massive amounts of data that translate poorly to stakeholders.
Sounds familiar?
There are so many products and solutions on the market for social media data analytics, so how do you get started on what’s best for your business? We’ve got the perfect reporting solution for you.
That’s where Power BI and its benefits come into play. Power BI analytics is a powerful digital marketing tool for data visualization.
Microsoft Power BI allows you to create beautiful reports and dashboards on the fly which can be consumed on the web and across devices. Power BI allows you to connect to hundreds of data sources, simplify prep and perform ad-hoc analysis. This allows you to explore new possibilities within the marketing ecosystem.
In this article, we’ll share the top secrets of power BI and why all marketers should use it for their reporting. Let’s go!
This article is for you if….
✅ …If you run a social media agency with a portfolio of clients
✅…If you manage your in-house social media accounts with multiple campaigns
✅…If you are a social media or digital marketer wanting to upgrade your data tools
What’s in it for me as a marketer using Power BI?
If you need a refresher course or introduction into the world of Power BI, you can read our previous blog articles here and here.
Successful marketing comes down to generating outcomes and reporting on those outcomes. The more effective your reporting is, the easier it is to keep the marketing ecosystem going.
The major draw of Power BI is the ability to combine marketing data from multiple sources.
Rather than manually combining the ad spends and conversion rates from all your social media marketing channels, Power BI allows you to aggregate all metrics from LinkedIn, Facebook, Instagram, Google AdWords, organic metrics, or data from your CRM can be easily added in via the Windsor AI connector (which we’ll get to in a minute below).
Additionally, Power BI can automate much of the manual reporting that takes time away from optimizations and strategy. These datasets, in turn, can easily be configured into dashboards with charts, graphs, and other interactive visualizations that give insight into all areas of marketing analytics.
These marketing dashboards provide you the tools to tell the story of every dollar, impression, click, conversion, and purchase.
When your management can get real-time data and insights on campaigns and metrics, it creates a level of transparency that removes the discomforts around budget and performance conversations.
Using Windsor AI API connector in Power BI to pull data
Windsor.ai is an ETL platform that abstracts data from social media platforms, revamp it, and logically loads the conclusions to Power BI.
As a social media marketer, you’re able to accelerate your decision-making capacity and promptly accumulate optimizations without wasting time.
With Windsor Marketing Performance Management Software, you can efficiently analyze and optimize marketing performance. Its data-driven approach will help you find the impact of each channel to identify the channel that drives traffic, leads, and conversions.
Windsor.ai lets you connect all your marketing, CRM and analytics data to from 50+ platforms and stream it to any spreadsheet tool, BI platform or your data warehouse.
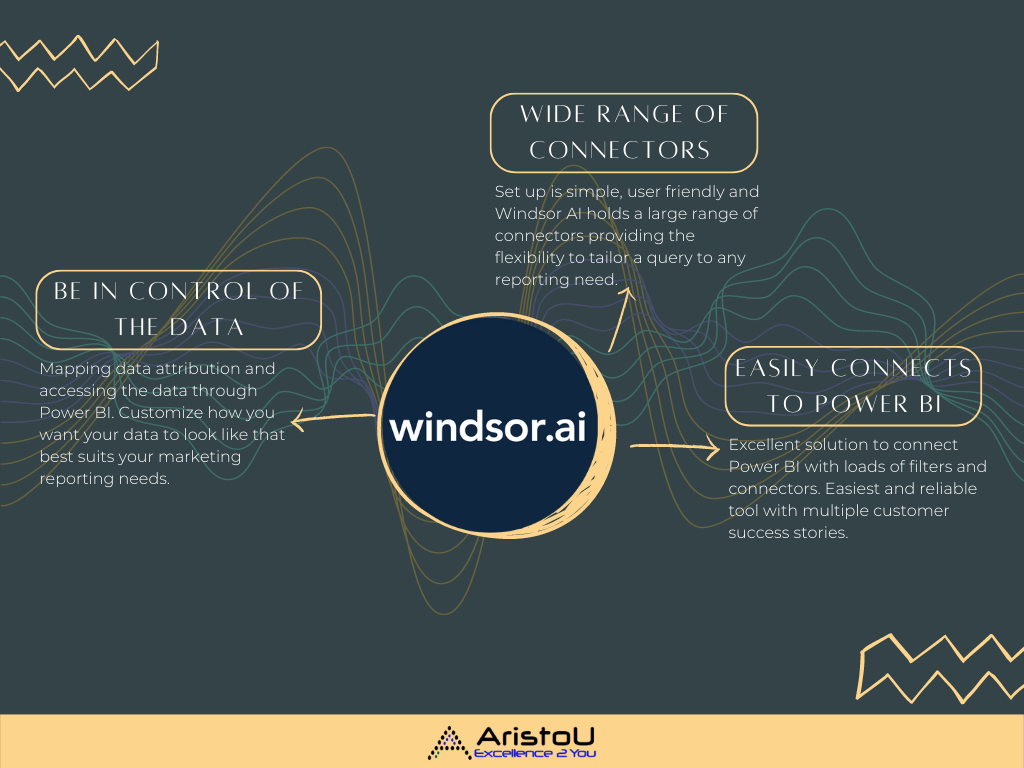
Why Windsor AI is better than the others
-
Be in control of the data
-
Wide range of connectors
-
Easily connects to Power BI
Be in control of the data
-
Windsor AI does the heavy lifting of getting the data in the right place and mapping the attribution and then providing you access to the data through a bunch of different BI tools or their own platform.
-
A marketing attribution platform where you are truly in control of what data you want where and how you want to represent it.
-
Windsor AI tops other platforms with providing the user insights that combines the server-side data and client-side data to make together.
Wide range of connectors
-
Windsor.ai has a fantastic range of connectors that provide amazing insights. The set-up is very easy and the amount of value you can get out of the data is immense.
-
Windsor AI holds a large range of connector locations, providing the flexibility to tailor a query to any need.
-
If any help is needed, our friendly consultants at Aristou will help support any Windsor AI’s questions and queries.
Easily connects to Power BI
-
Excellent solution to connect Power BI with a variety of filters and connectors available, excellent value for money and – more important – exceptional support!
-
Windsor.ai has been by far the easiest and most reliable tool to accurately and consistently import data into Google Data Studio and Power BI according to many trusted testimonials.
How does Power BI differ from other products in the market when it comes to social media analytics?
The major draw of Power BI analytics tool is the ability to combine marketing data from different sources. Rather than manually combining the ad spends and conversion rates from all your social media marketing channels, Power BI can allow you to aggregate all metrics from LinkedIn, Facebook, Instagram, Google AdWords, organic metrics, or data from your CRM.
These datasets, in turn, can easily be configured into dashboards with charts, graphs, and other interactive visualizations that give insight into every aspect of marketing analytics.
These marketing dashboards allow you to tell the story of every dollar, impression, click, conversion, and purchase.
-
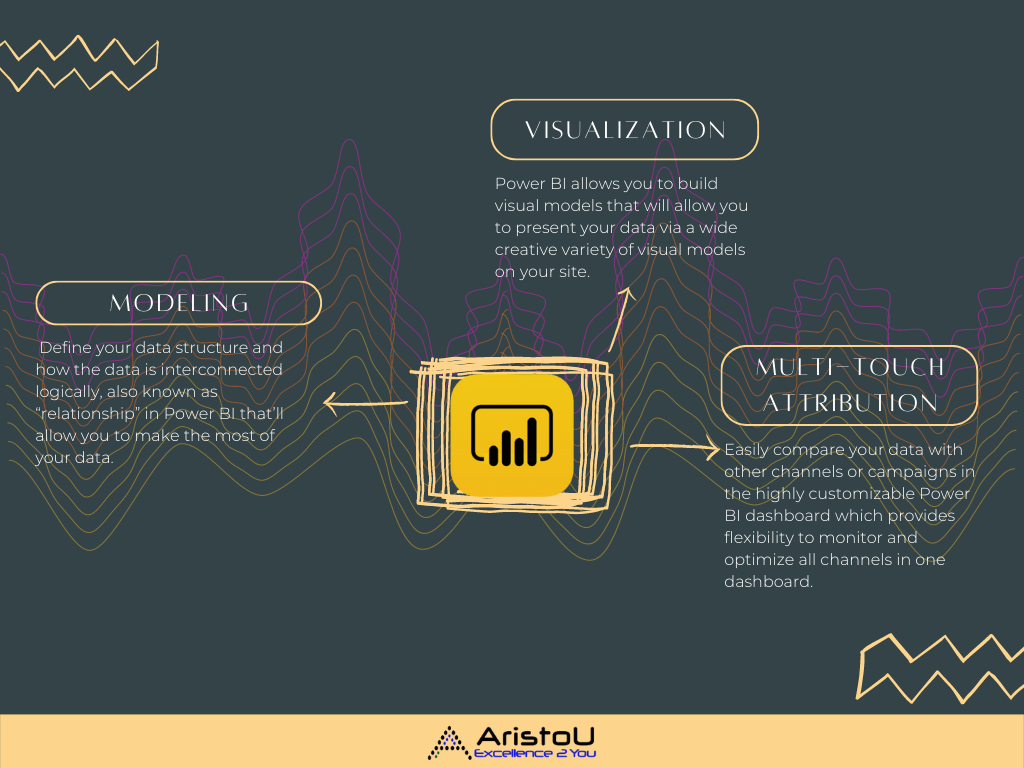
Modeling
-
Visualization
-
Multi-touch attribution reporting insights
Modeling
-
Businesses often use data that comes from various sources. If you’re an omnichannel retailer, you can gather customer data both in store and online. If you only sell online, you’re able to collect data from different channels. The data needs to be integrated to make the most of it.
-
Modeling is the process of defining data structure, processes and how the data is interconnected logically. The connection is called a “relationship” in Power BI. I.e., modeling is the process of building models that’ll allow you to make the most of your data.
Visualisation
-
Visualization is the next stage, presenting your data visually. I.e. Power BI allows you to build visual models that will allow you to present your data to anyone.
-
You’ll be able to embed the visual models on your site- there are different types of charts that are available in Power BI, including area charts, bar charts, combo charts, line charts, doughnut charts, etc.
Multi Touch Attribution reporting insights
-
Easily compare your data with other channels or campaigns in the Power BI analytics dashboard.
-
Enjoyed the customizable dashboard from Power BI which gives us flexibility to make the best use of the platform, to monitor and optimize all channels in one dashboard.
-
As long as the data field sets are recognized by Windsor AI, you’ll be able to integrate multiple channels onto the Power BI dashboard with super equipped support staff by Windsor.
-
You can use Power BI to better understand what your customers and the market think of your product. All that messy data scattered all across your social media pages can be presented neatly.
-
From Facebook, Instagram, LinkedIn, TikTok, Google Ads etc, you’ll be able to easily compare your paid keywords with organic keywords and view the comparison as a model.


Leave a Reply