Power BI vs Tableau- which is the better business intelligence tool?
Who runs the world?
Data.
The future of analytics is here to stay and more companies are prioritizing business intelligence.
You’ve heard of it, you’ve read articles on it, but what exactly is the hype on business intelligence really about?
In this blog post, we’ll be diving into the overarching term of Business Intelligence, and a deep dive into 2 of the hottest BI tools in the market: Power BI and Tableau.
Wondering what’s the difference and which tool to use? Keep on reading!
What is BI and why is it matters
Business intelligence (BI) is a broader term that covers the processes and methods of collecting, storing, and analyzing data from business operations or activities to optimize performance.
In other words, it is a cluster of processes, architectures, and technologies that collectively contribute to informed decision-making.
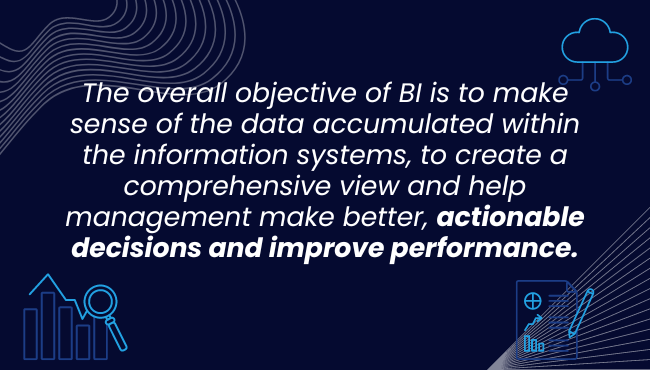
The overall objective of BI is to make sense of the vast amount of data accumulated within the information systems of enterprises using data analytics, data visualization, process analysis, etc.
All these things come together to create a comprehensive view of a business to help management make better, actionable decisions and improve performance.
So, Power BI or Tableau? Which one you ultimately choose simply depends on how you need to use these tools in your business.
Just to recap: Tableau Software and Microsoft Power BI compete against each other in the Business Intelligence (BI) Data Visualization Analytics Dashboard Data Analysis.
Let’s dive right in!
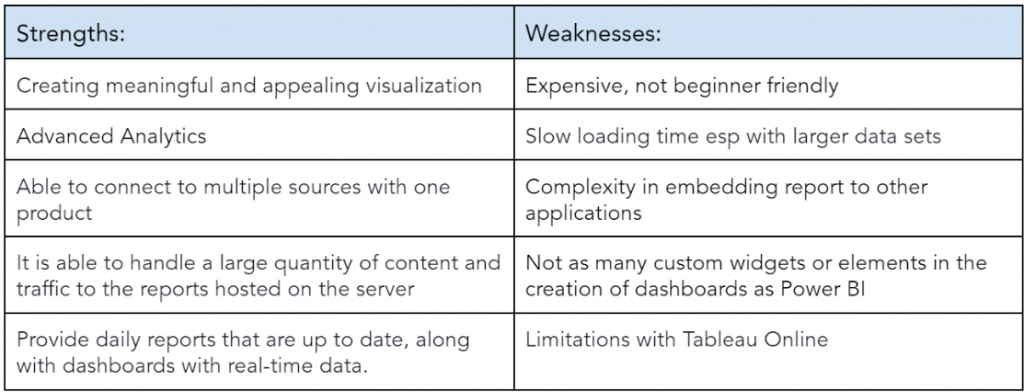
What is Tableau?
![]()
Tableau is a business intelligence software that visually represents data from varied sources to create interactive and shareable dashboards.
This tool has made the entire process of analyzing data and questioning your product-market fit, easier. It has various in-built features for data exploration without getting overwhelmed by the software elements.
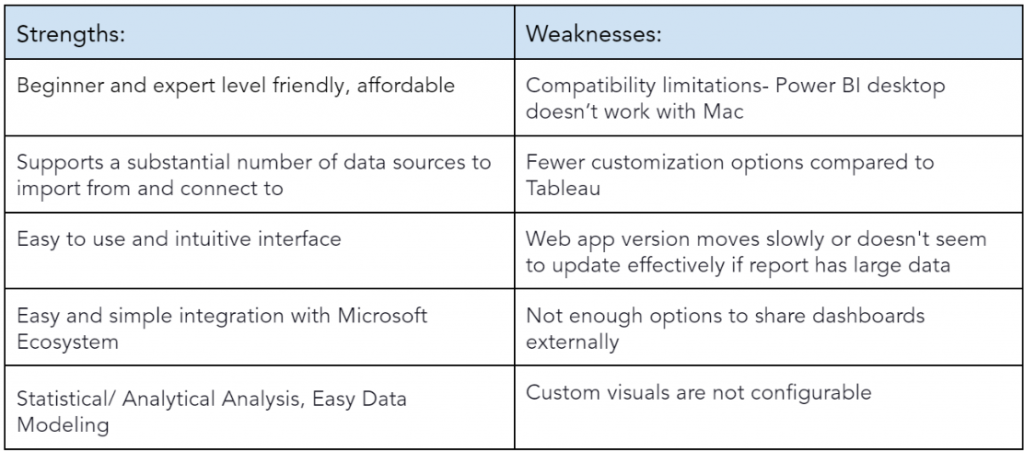
What is Power BI?

Power BI was introduced by Microsoft to combine the multiple data visualization features into one. Power BI comes as a package of three major components:
-
Power BI services
-
Power BI Desktop
-
Power BI mobile app
With these three components, Power BI lets you create a data-driven insight into your business. Based on various roles, you can leverage Power BI to your benefits like creating reports, monitor progress, integrate APIs, and many more.
For 13 consecutive years, Gartner has recognized Microsoft as a Magic Quadrant Leader, followed by Tableau in a close second as a leader in the analytics and business intelligence space. (see diagram 1).
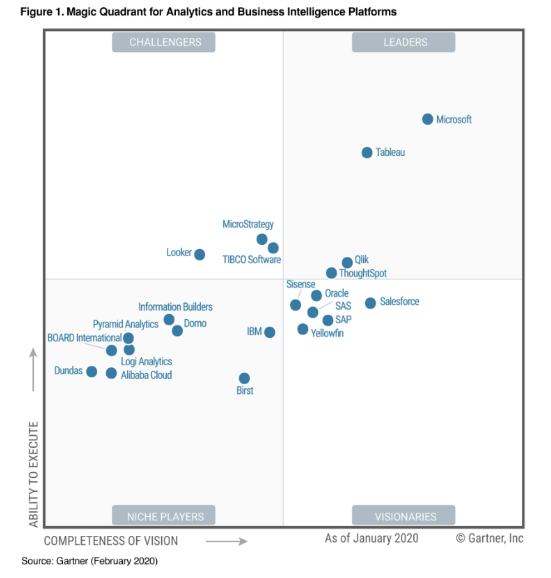
Diagram 1
Deep dive comparison between Power BI and Tableau
Below is a snapchot of the feature comparison between Power BI and Tableau, adapted from TrustRadius Research (2022):
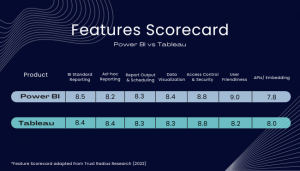
Let’s further explore the comparison between these 2 tools with a deeper analysis below:
| Power BI | Tableau | Winner | |
| Pricing |
|
|
Power BI |
| Target Audience |
|
|
nil |
| Market Share |
|
|
Tableau |
| Product Linkage |
|
|
Power BI |
| Deployment options |
|
|
Tableau |
| Data sources |
|
|
nil |
| User friendliness |
|
|
Power BI |
| Community |
|
|
Power BI |
| Differentiation |
|
|
Nil |
When to use Power BI, and when to use Tableau?
If you are…..an experienced or beginner user, lead for user-friendliness, budget-friendly, an existing user of other Microsoft products,
….then Power BI is for you.
If you are….a data analyst, have prior data analysis experience, appreciate speed and capabilities, have a larger budget,
….then Tableau is more suitable for you.
Ultimately, there is no right or wrong tool to use. Each tool has its pros and cons and fits different needs and requirements.


Leave a Reply