What is the single most important thing when it comes to making good business decisions?
Data.
Locally and around the world, thousands of customers use technology in different ways to get the most out of the data in every shape and form. In our previous post, we covered the introduction on what Power BI is and why it is good for your business. If you haven’t checked that out, you can read it here.
In today’s post, we will be diving more in-depth into the technicalities of Power BI, and 6 ways how your business can illustrate data.
6 ways to turn your business insights into action
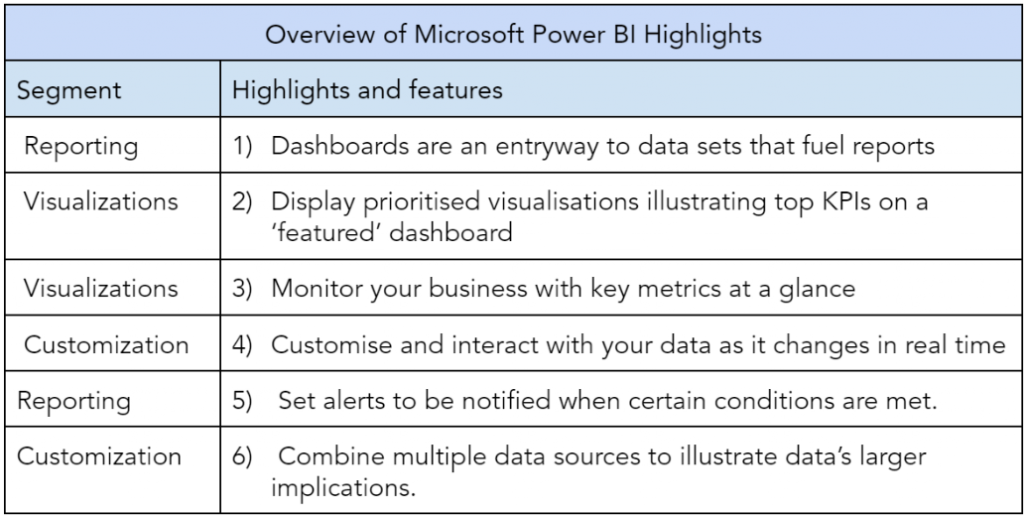
Power BI is a great tool for turning your business data into actionable steps. We’ve broken it’s key features into 3 main segments relevant for your organization: Reporting, Visualization and Customization.
Below is a simple analysis of how Power BI works seamlessly within the 3 main segments for your business.
Reporting
1. Streamline reporting with custom dashboards
Time is money in business, and every minute counts. With Power BI’s centralized system, you’ll be able to store and streamline all reporting in 1 place with highly customized dashboards for maximum efficiency and business decisions.
2. Extensive capabilities to connect with third party apps for reporting
Microsoft Power BI allows you to easily connect and aggregate data from a variety of sources, from inside your organisation or with third-party business partnerships. You’re able to incorporate the sources that matter most to your data story to clearly present the macro view to management.
Visualizations
3. Aggregate data to tell a cohesive story
Storytelling is key in any big data reporting, and Power BI helps you tell your business story by pulling together comprehensive, visual dashboards that can clearly organise information in one multifunctional place.
4. Use real-time data to improve collaboration
What’s better than data? Real-time data easily obtainable on your fingertips. The Microsoft Power BI mobile app allows you to easily collaborate with your team and generate meaningful reports, annotate on-the-go, build internal and client-facing apps or publish to the web to interact with a wider audience.
Customization
5. Connect to your data anywhere
The mobility of Power BI’s app creates flexibility in staying connected to your data and sharing insights at offsite meetings with the Microsoft Power BI app, both available in Android and iOS. View and modify dashboards and reports anywhere, and maximize the touch-optimised experience and real-time alerts that are fully customizable.
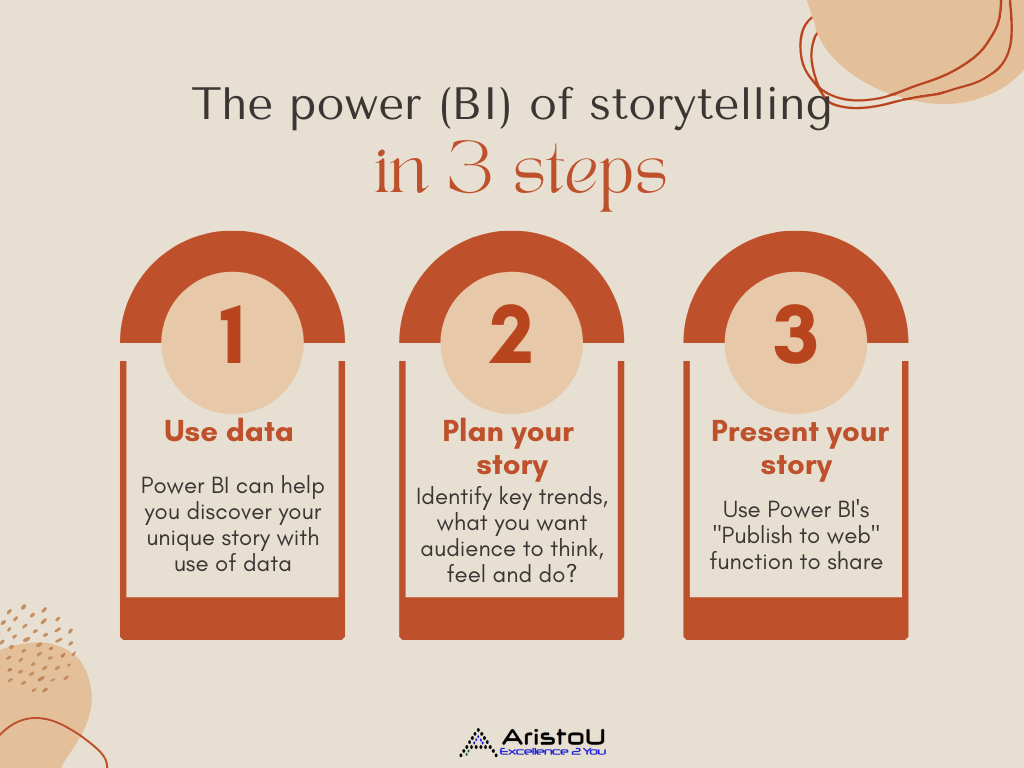
The power (BI) of storytelling in 3 steps
Another great feature about Power BI is that it doesn’t just leave you with a bulk of data, but it weaves the data into a story to bring your business to the next level. Using data to tell your story is a competitive advantage that sets you apart from your competitors to make the best business decisions for the future.
1. Use data to tell your story
Did you know Power BI can help you discover your unique story? Modern storytelling requires the effective use of data. How do you know what the story is?
2. Planning your story
First, compile all data in one place for clearer visualization. Oftentimes you may not know exactly what the story is until you visualize it. Visualizing your data in Power BI is a great first step in identifying the truth in your data.
With a clear picture in front of you, you’re able to identify key trends: what are these trends telling me? Is there a deeper narrative leading to an increase or decrease of xyz? Once you have a better understanding of what your data is telling you, you can begin planning the story arc.
The key for an effective story is to identify specifically what you want your target audience to take away from the story. How would you want your audience to think, feel and do?
Leaving the audience with tangible insights via the visualizations you created should be the goal of any effective data storytelling.
3. Presenting your story
After you’ve figured out your data story, the next step is to present the story clearly and constructively to the audience.
Microsoft Power BI has made it a goal to always enable users everywhere to experience data in the best way possible. Power BI’s feature: “Publish to web” is created to allow users to share compelling stories with interactive data visualizations in minutes. Users are able to use the “Publish to web”platform to embed visualizations in your blog, website, emails, or even social media accounts.
In this blog post, we dived deeper into the highlights of Power BI, and how it is a powerful tool for turning data into strong narratives for your consumers and business.
The 3 key segments we covered in this article are: reporting, customizations and visualizations. These 3 segments all relate back to storytelling, turning your data into actionable insights.
While implementing Power BI may seem daunting at the beginning, it can pay for itself with sharp, accurate and actionable data insights for your business, resulting in a long term gain and advantage for your company. Stay tuned for the next part of our Power BI series to learn more!


Leave a Reply