Microsoft Power BI- Part 3: How to make Data Visualization work for your business
The global business intelligence market is predicted to expand from $23.1 billion in 2020 to reach $33.3 billion by 2025 (MarketsandMarkets 2020).
In spite of a rough couple of years brought about by the global pandemic across all industries, data-driven business decisions made by harnessing the power of business intelligence (BI) has been more crucial than ever.
The importance of leveraging data has become more pivotal as the move to remote working has forced significant shifts in how businesses conduct their day-to-day operations, interact with their suppliers and customers and how their employees work.
This article will show you how to fully utilize Power BI in enabling data driven business insights using strong data visualization. Before we get to that, let’s do a quick recap on the definition of Power BI.
Recap on Power BI + 3 segments of Power BI
Microsoft Power BI is a business intelligence solution that allows you to analyze your raw data and visualize it via dashboards and reports. Insights gained from Power BI then enables you to turn this information into data-driven business actions. Now that we have the definition of Power BI out of the way, let’s talk about data visualization.

What is Data Visualization and why is it important?
Data visualization is the graphical representation of datasets and information. Simply put, it is visualizing the data into digestible, easy to understand formats. Visualizing data is a fundamental step in understanding trends, uncovering patterns, and tracking outliers.
According to experts prediction, the data visualization market will expand greatly within the next five years, with compound annual growth rates of over 10%, growing to a $19.2 billion market valuation by 2027. Much of this growth is due to growing interest in business intelligence (Greengard 2022).
According to Deloitte (2019), companies with leadership spearheading data-driven decisions are 77% more likely to achieve business goals. They are also 59% more to derive actionable insights from analytics results.
Businesses are continuing to invest in BI and analytics tools to make better decisions during the rest of the pandemic and beyond. The ultimate goal is to visually represent your data in an accessible and easy-to-understand manner regardless of the environment.
How Power BI helps with strong data visualization
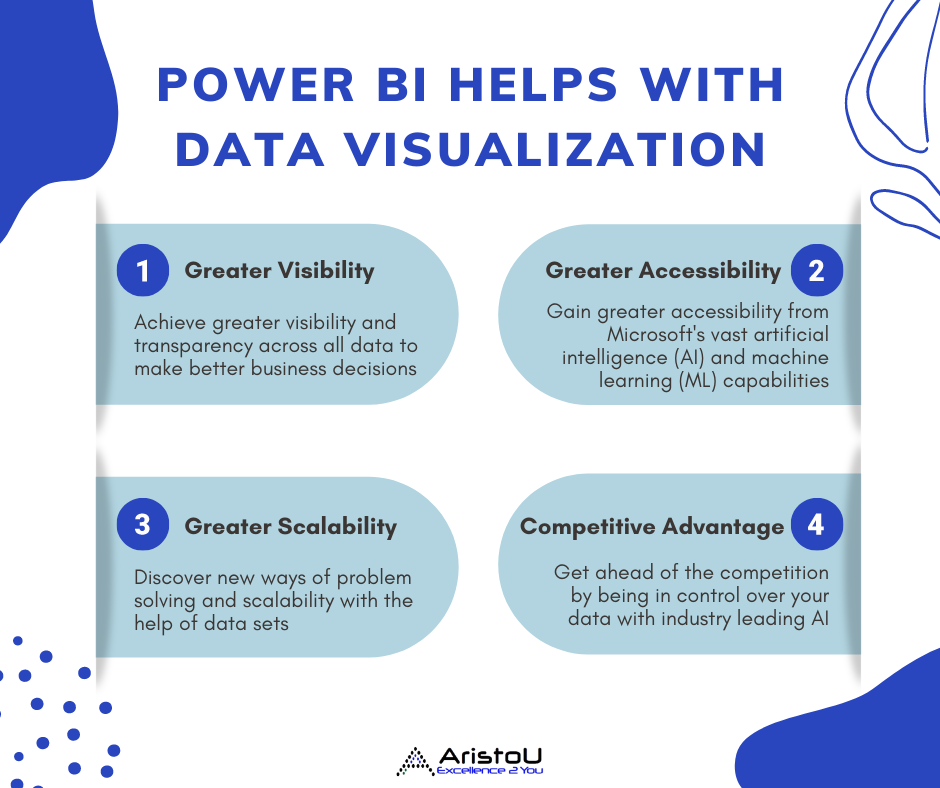
The role of every Power BI tool is supposed to support business processes across an organization. These can range from events on how a product or service is performed, to predicting future scenarios. Below are 3 effective ways to achieve more influence over your data visualization skills for success:
-
Greater Visibility:
-
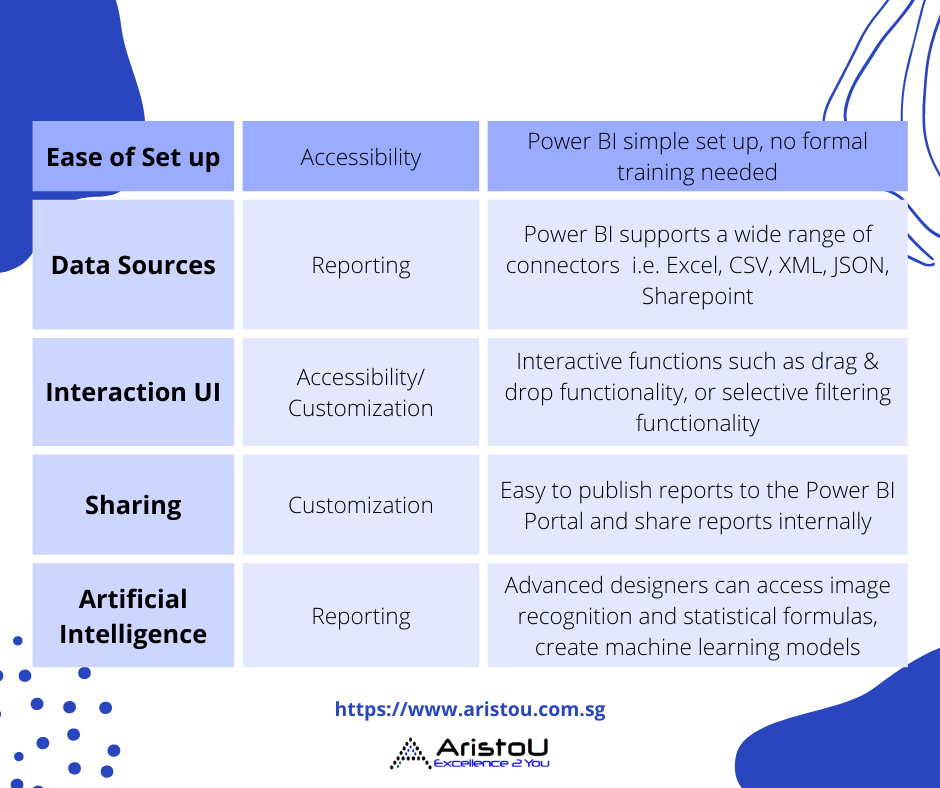
Power BI is one of Microsoft’s high end visualization tools, providing classic data visualization tool elements like interactive dashboards and APIs for integration. Power BI delivers powerful automation and includes tools to align setup and operation with business objectives.
-
-
Greater Accessibility:
-
-
A key feature of Power BI is in its artificial intelligence (AI) and machine learning (ML) capabilities. Microsoft AI is incorporated to allow non-data scientists to plan and build full machine learning models and quickly track insights from their data sets.
-
-
Greater Scalability:
-
-
Gaining an understanding of how each data visualization application can help with data sets and data tracking will generally reveal each solution’s potential for scalability. This provides an unlimited scope of how big you can scale your product, and find the best solutions on how to work around it.
-
Microsoft Power BI has been recognized as a leader in the 2021 Gartner Magic Quadrant for Analytics and Business Intelligence Platforms for the last 14 years (Microsoft 2021).
One of the biggest advantages you will gain from using Power BI is it’s industry-leading AI that triumphs over its competitors. It stimulates powerful data visualizations across large amounts of unstructured data.
Advanced tips on using Power BI
1. Enhance datasets with DAX expressions
-
-
When you’ve mastered the basics of Power BI, you can start transforming data with DAX expressions. Data Analysis Expressions (DAX) is a library of functions and operators that can be combined to build formulas and expressions in Power BI, Analysis Services, and Power Pivot in Excel data models for strong data visualization, just to name a few. DAX formulas provide the capability of calculating advanced metrics, eg: analyzing growth percentages across product categories including different date ranges, or calculating year-on-year growth compared to market trends etc. For a more comprehensive list of explanations and examples, it can be found here.
-
2. Find the owner
-
-
If you have questions about a dashboard, report, or app within Power BI, you can look up the owner. With the content open, select the title dropdown to display the owner. The owner may be a person or a group. This way, when you have enquiries on the data, it’s easier to solve and directly approach the owner.

-


Leave a Reply