
Microsoft Power BI- Part 1: What is Power BI?
They say data is king, but how do you make the data work for your business when there’s an overwhelming amount of information out there?
Picture this- your team sends you dozens of reports, excel spreadsheets, emails with multiple attachments, charts, and even printed handouts. You find yourself in a time crunch and fear that the most recent information isn’t on your hands.
You continuously sieve through enormous amounts of data, and receive an email from your boss chasing you for the relevant data to decide on the next business decision.
The data is where the decision lies.
Introducing: Microsoft Power BI as the perfect tool to make your job easier and more impactful. In this post, we’ll define Power BI, what it does, and provide you with a realistic pros and cons list of why Power BI is the best tool for your company.
What is Power BI?
Power BI is a set of intelligence business tools and is a business analytics service by Microsoft. It provides interactive visualizations and business intelligence capabilities with a user-friendly interface for users to create their own reports and dashboards. It’s features allow you to turn your unrelated sources of data into visually immersive and interactive insights.
Power BI lets you easily connect to your data sources, visualize and discover what’s important, and share that with anyone in your team. You’re then able to use the Power BI service to explore reports and dashboards in order to make accurate business decisions.
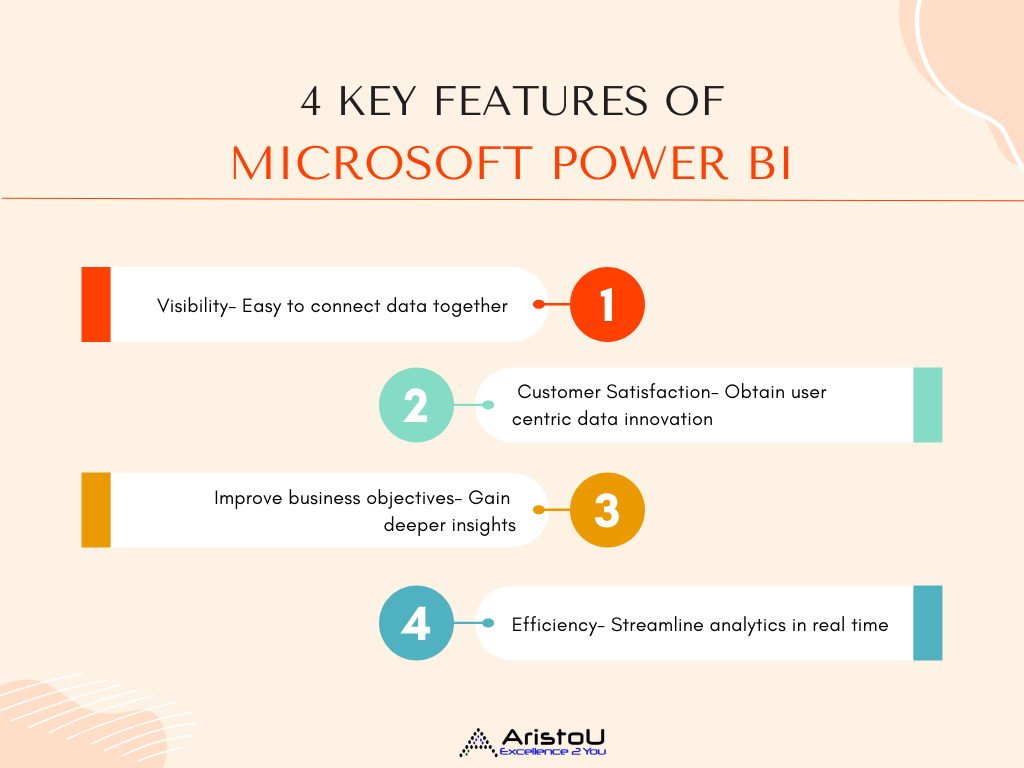
Below are 4 key features of Power BI and what it can offer for your business. Power BI not only has high compatibility with Microsoft Dynamics 365 Business Central, but it also improves profit, efficiency and customer satisfaction for your organization.
1) Visibility- Easy to connect data together
-
High in-built connectors support
-
Power BI provides connectivity to a wide range of cloud based sources with a growing library of 500+ free connectors. This provides access to different databases for data-driven decision making.
-
Highly customizable
-
Users are able to customize elements further to preferences, or have your data experts start from scratch by importing your datasets and developing your own dashboard and reports.
-
User-oriented
-
Power BI’s drag-and-drop interface also means Power BI can combine multiple files (such as Excel spreadsheets) and let you analyse the merged data in one report
2) Customer Satisfaction- Obtain user centric data innovation
-
Strong Microsoft Power BI Community
-
Being part of the Power BI community gives you access to frequent updates that improve Power BI features and capabilities—based on thousands of ideas submitted annually from a community of more than half a million members worldwide.
-
Improve customer satisfaction
-
Connect, learn and discuss with business intelligence experts and peers to improve on overall customer satisfaction level.
3) Improve business objectives- Gain deeper insights
-
Optimize data to maximum efficiency
-
Transform your data into competitive advantage by using Power BI and Microsoft Business Central together to connect, combine, and analyze your entire data estate.
-
Collaborative nature
-
Collaborate seamlessly with your team across Power BI, providing a single version of data truth that delivers insights across your business.
4) Efficiency- Streamline analytics in real time
-
Make most relevant decisions
-
Power BI tools let you know what’s happening in both the past and present to predict the future. From factory sensors to social media sources, get access to real-time analytics so you’re always ready to make timely decisions.
Who uses Power BI
Anyone- even you. While Power BI is mostly used by data analysts and business intelligence professionals who create the data models before disseminating reports throughout the organisation, anyone without an analytical background can still navigate Power BI and create reports.
Tips and Reminders for Power BI
1) Drill on the basics
-
Transforming visuals from data is a fundamental skill to learn prior to getting started with Power BI. Learning about sharing your visuals and data with your team in the right format is essential to fully optimize Power BI.
2) Better together
-
Microsoft Power BI sits well on top of other Microsoft Technologies and both work well to create the best results for your business. When Power BI is used on top of Microsoft Dynamics 365 Business Central, you extract maximum value from your technology and data. Power BI interoperates with the Microsoft technology you already trust, making it easier to use all your data productively.


Leave a Reply